
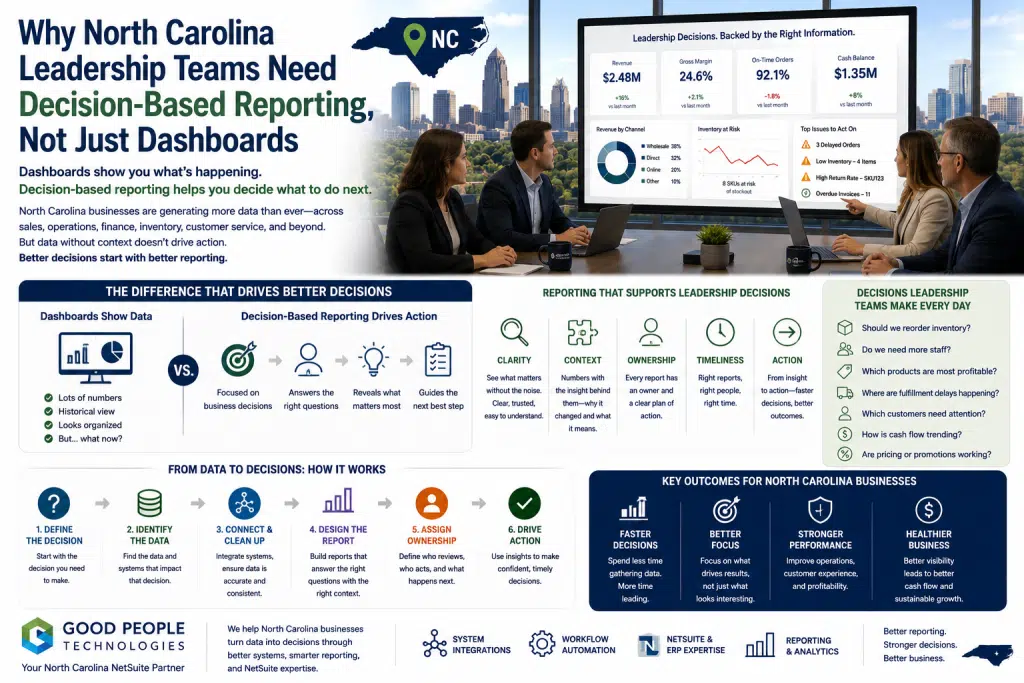
Decision-based reporting North Carolina companies can actually use starts with a simple question: what decision should this report help someone make? Many growing businesses already have dashboards, charts, KPIs, and software tools, but leadership teams can still struggle to turn that information into clear action. The issue is rarely a lack of data. More often, the data is not organized around the decisions the business needs to make.
For North Carolina companies in Charlotte, Raleigh, Durham, Greensboro, Winston-Salem, Asheville, Wilmington, and other growing markets, reporting often becomes more complex as the business scales. A company may add more systems, more sales channels, more employees, more customers, more locations, or more product lines. Each step creates more data, and every department may build its own reports to manage daily work.
Dashboards can help bring that information into one place.
However, a dashboard is only useful when it answers the right business question.
A leadership team may see revenue, order volume, inventory levels, open projects, customer issues, warehouse activity, and margin trends. Those numbers may look organized, but they may not clearly show what needs to happen next. Should the company reorder inventory? Adjust staffing? Review pricing? Follow up with a customer segment? Investigate fulfillment delays? Pause a campaign? Improve a workflow?
That is where decision-based reporting becomes more valuable than dashboards alone.
Dashboards show information. Decision-based reporting connects information to action.
This article explains why North Carolina leadership teams need decision-based reporting, how dashboards can fall short when they are not tied to decisions, and how better reporting design, system integrations, automation, ERP, and NetSuite planning can help companies make faster, clearer, and more confident decisions.
Why Dashboards Became the Default Reporting Goal
Dashboards are popular for good reasons.
They are visual, easy to scan, and helpful for summarizing complex information. A well-designed dashboard can show leadership what is happening across sales, operations, finance, inventory, customer service, fulfillment, or projects.
For a growing business, that can feel like progress.
Instead of waiting for spreadsheets or static reports, leadership can open a dashboard and see key metrics in one place. Teams can monitor trends, compare performance, and reduce the time spent searching for basic information.
This is useful.
The problem begins when dashboards become the goal instead of the tool.
A company may invest time in building a dashboard without first defining the decisions it should support. The result may look polished, but still leave leadership asking the same questions after every meeting.
What changed? Why did it change? Who needs to act? What should happen next?
A dashboard can show that order volume increased. Decision-based reporting helps determine whether the increase requires more inventory, more staff, better fulfillment capacity, pricing changes, or a customer service adjustment.
That difference matters.
A dashboard that only displays numbers may create awareness. A report tied to a decision creates movement.
The Difference Between Data, Dashboards, and Decisions
Data is raw information.
Dashboards organize that information visually.
Decisions happen when people use the information to choose an action.
These three things are connected, but they are not the same.
A business may have plenty of data and still lack useful visibility. Another company may have dashboards but still rely on meetings, spreadsheets, and manual explanations before leadership can decide what to do.
Decision-based reporting bridges that gap.
Instead of asking, “What data can we show?” the reporting process starts by asking, “What decision do we need to support?”
That shift changes how reports are designed.
A revenue dashboard may become more useful when it shows margin, channel performance, return volume, fulfillment cost, and customer mix. An inventory dashboard may need available inventory, committed inventory, lead times, stockout risk, and demand trends. A customer service dashboard may need repeated issue categories, delayed order reasons, and customer segments affected.
The report becomes more valuable because it reflects the business action behind the metric.
Leadership does not need every possible number.
It needs the right context for the next decision.
Why Leadership Teams Need More Than Visibility
Visibility is important, but visibility alone is not enough.
A leadership team may see that something is happening and still not know what to do with that information.
For example, a dashboard may show that sales are increasing. That seems positive. Yet leadership may need to know whether margin is improving, whether fulfillment is keeping up, whether inventory is under pressure, whether finance can reconcile the increase cleanly, and whether customer service volume is also rising.
A dashboard may show open orders. That is useful. The decision, however, may depend on which orders are delayed, why they are delayed, which customers are affected, and whether purchasing, warehouse, or staffing changes are needed.
Another dashboard may show customer complaints. To act, leadership needs to know whether complaints are tied to specific products, fulfillment delays, billing issues, return policies, or communication gaps.
Visibility tells the business what is happening.
Decision-based reporting helps explain what response makes sense.
For North Carolina companies managing seasonal demand, growth pressure, distribution complexity, manufacturing workflows, e-commerce operations, or service delivery, this distinction can affect daily performance.
The company does not need more charts for the sake of more charts.
It needs reporting that helps the team move from observation to action.
Why Dashboards Often Fail to Change Behavior
A dashboard can be accurate and still fail to change behavior.
This usually happens when the dashboard is not connected to ownership, cadence, thresholds, or action.
A team may review a dashboard every week but not have a clear process for responding to what it shows. A metric may turn red, but nobody knows who owns the issue. Leadership may notice a trend, yet the report may not show enough detail to decide whether the problem belongs to sales, operations, finance, warehouse, purchasing, customer service, or systems.
When a dashboard does not change behavior, it becomes passive.
People look at it, discuss it, and move on.
Decision-based reporting is different because it connects metrics to responsibility.
A useful report should help answer:
- What decision does this support?
- Who uses this information?
- How often should it be reviewed?
- What action should happen when the number changes?
- Who owns the next step?
- What threshold requires attention?
- Which system is the source of truth?
- What context is needed before acting?
These questions turn reporting into a management system.
Dashboards can still be part of that system, but they are not enough by themselves.
Decision-Based Reporting North Carolina
Decision-based reporting North Carolina businesses can rely on should be designed around real operating decisions, not only around available data. The goal is to help leadership understand what needs attention, why it matters, and what should happen next.
For growing companies, this can apply across many areas:
- sales performance
- inventory planning
- cash flow visibility
- purchasing decisions
- warehouse performance
- order fulfillment
- customer service trends
- project profitability
- marketing performance
- staffing needs
- margin analysis
- finance reconciliation
- operational bottlenecks
A dashboard may show a metric in each of these areas. Decision-based reporting goes further by connecting the metric to a business question.
For example, sales reporting should not only show revenue. It should help leadership understand where revenue is coming from, whether the revenue is profitable, which channels are creating pressure, and what should be done next.
Inventory reporting should not only show stock levels. It should help teams decide what to reorder, what to slow down, what is at risk, and which products may create fulfillment issues.
Finance reporting should not only summarize performance. It should help leadership understand cash flow, margin, reconciliation issues, and operational cost.
When reports are built around decisions, they become easier to prioritize and more useful in meetings.
The Problem With Reporting That Starts From Available Data
Many reporting projects begin with available data.
That is understandable.
A company looks at the systems it has and asks what can be reported from them. The team may build dashboards from accounting software, CRM data, ERP data, e-commerce platforms, warehouse systems, project tools, or spreadsheets.
This approach can produce reports quickly.
It may not produce the reports leadership actually needs.
Available-data reporting tends to answer the question, “What can we show?”
Decision-based reporting asks, “What do we need to decide?”
The second question is more powerful.
A company may have easy access to sales volume, but the real decision may require margin by product. Another business may have customer service ticket counts, but leadership may need issue patterns by product, location, order type, or customer segment. A distributor may track inventory on hand, while purchasing needs available stock, committed quantities, supplier lead times, and reorder risk.
When reporting starts from available data, dashboards may become limited by system convenience.
When reporting starts from decisions, the business can identify which data needs to be connected, cleaned, defined, or collected differently.
That creates a stronger roadmap for reporting improvements.
Why Different Teams Bring Different Numbers
Different numbers are common in growing companies.
Sales may report orders booked. Finance may report invoiced revenue. Operations may report fulfilled orders. Customer service may track delayed orders. Inventory may separate available stock from committed stock. Leadership may receive a spreadsheet that blends several views.
Each number may be valid.
The problem appears when the business has not clearly defined which number supports which decision.
A leadership team may ask, “How did we perform this month?” Sales, finance, and operations may all answer differently because they are measuring different parts of the business.
This does not mean one department is wrong.
It usually means reporting definitions need to be clarified.
Decision-based reporting helps by tying each metric to a specific use case.
Booked sales may support sales pipeline review. Invoiced revenue may support financial reporting. Fulfilled orders may support operational performance. Open orders may support customer service and warehouse planning. Available inventory may support sales commitments and purchasing.
Once each number has a defined purpose, disagreements become easier to resolve.
The company can stop asking which number is “the real one” in a vague way and start asking which number is right for the decision being made.
Why Reporting Cadence Matters
A report can be accurate but still arrive too late.
Cadence matters because different decisions happen at different speeds.
Some decisions need daily visibility. Others can be reviewed weekly, monthly, or quarterly. A leadership team does not need every report in real time, but it does need each report at the right time for the decision it supports.
Inventory risks may need daily attention during busy seasons. Cash flow may need weekly review. Sales trends may need frequent monitoring during campaigns. Financial close reports may follow a monthly cadence. Strategic profitability reviews may happen less often.
When cadence does not match the decision, reporting loses value.
A delayed inventory report may describe a stockout after the opportunity has passed. A monthly customer service report may reveal an issue that should have been addressed earlier. A daily report on a slow-changing metric may create noise rather than insight.
Decision-based reporting North Carolina companies can use effectively should match the rhythm of the business.
The report should arrive when it can still influence action.
Why Ownership Is Essential
Reports need owners.
Without ownership, reporting becomes fragile.
A dashboard may exist, but no one may be responsible for maintaining its definitions. A saved search may be used by several teams, yet nobody may know who should update it. A spreadsheet may support leadership decisions, while the person who created it is the only one who understands how it works.
Ownership gives reporting accountability.
A report owner does not need to make every business decision. The owner is responsible for making sure the report remains useful, accurate, understood, and aligned with the decision it supports.
This matters especially in ERP and NetSuite environments.
Saved searches, reports, dashboards, workbooks, and spreadsheets can accumulate over time. Some become essential. Others become outdated. A few overlap or contradict each other.
Without ownership, reporting problems continue quietly.
Leadership may not know which report should be trusted. Teams may update similar reports separately. Manual fixes may remain hidden.
Decision-based reporting makes ownership easier because the report’s purpose is clear.
When the decision is known, the right owner is usually easier to identify.
Dashboards Need Context, Not Just Metrics
Metrics without context can be misleading.
A dashboard may show that sales increased, but not whether profitability improved. Another view may show fulfillment delays, but not whether the issue is staffing, inventory availability, supplier timing, warehouse workflow, or order complexity. A customer service metric may rise, but the dashboard may not show whether the increase is tied to growth, product defects, delayed shipping, billing confusion, or seasonal demand.
Context helps leadership interpret the number correctly.
That context may include comparisons, thresholds, owners, time periods, customer segments, product categories, channel breakdowns, or operational notes.
A metric should not be isolated from the decision it supports.
For example:
- Revenue should often be viewed with margin, returns, discounts, and fulfillment cost.
- Inventory should be viewed with demand, committed quantities, lead times, and reorder risk.
- Customer service should be viewed with issue categories, response time, order status, and customer impact.
- Operations should be viewed with capacity, exceptions, bottlenecks, and delivery performance.
- Finance should be viewed with cash flow, reconciliation status, and operational drivers.
Dashboards become more useful when context is built into the reporting design.
Why Decision-Based Reporting Supports Better Meetings
Leadership meetings often depend on reporting.
When reports are unclear, meetings become slower.
People spend time explaining definitions, debating numbers, requesting follow-up reports, or asking someone to confirm the data later. The meeting may end with more questions than decisions.
Decision-based reporting changes the structure of the conversation.
Instead of reviewing numbers generally, the team reviews decisions specifically.
For example:
- Do we need to adjust purchasing?
- Should we add fulfillment capacity?
- Which customer segment needs attention?
- Are margins changing enough to review pricing?
- Which workflow is creating the biggest delay?
- Does this campaign deserve more investment?
- Which report should become the source of truth?
This makes meetings more productive.
The report is no longer just evidence that something happened. It becomes the basis for deciding what to do next.
For North Carolina leadership teams managing growth, decision-based reporting can help reduce meeting friction and improve follow-through.
How Decision-Based Reporting Helps Finance
Finance reporting is often where business complexity becomes visible.
Finance may need to connect revenue, costs, cash flow, accounts receivable, vendor bills, inventory value, refunds, discounts, taxes, payroll, and operational activity.
Dashboards can summarize financial performance, but decision-based reporting helps finance provide deeper guidance.
Leadership may need to know:
- Is growth improving margin or only increasing volume?
- Which products or services are most profitable?
- Where is cash tied up?
- Which customers affect working capital?
- Are fulfillment costs changing?
- Do discounts support profitable growth?
- Which reports are ready for review, and which require reconciliation?
These questions require more than a basic dashboard.
They require connected data and clear definitions.
For businesses using NetSuite, QuickBooks, or other financial systems, finance visibility improves when reporting is designed around business decisions rather than only accounting outputs.
This helps finance move from recording results to supporting forward-looking management.
How Decision-Based Reporting Helps Operations
Operations teams need reporting that supports action.
A general dashboard may show activity. Decision-based reporting helps teams identify constraints, exceptions, and priorities.
For example, operations may need to know:
- Which orders are delayed?
- What is causing the delay?
- Which warehouse process needs attention?
- Are staffing levels aligned with demand?
- Which products create fulfillment issues?
- Which suppliers are affecting delivery?
- Where are manual workflows slowing the team down?
These questions require reports that connect data to process.
Operations does not need more charts if the charts do not help decide what to fix.
A useful operations report should make the next step clearer.
That may mean prioritizing orders, adjusting capacity, reviewing supplier performance, improving warehouse workflow, automating updates, or escalating a recurring issue.
Decision-based reporting North Carolina companies use in operations should be practical, timely, and close to the work.
How Decision-Based Reporting Helps Sales and Customer Service
Sales and customer service teams rely on context.
A sales dashboard may show pipeline, revenue, or account activity. Customer service dashboards may show tickets, response times, or issue volume. Those metrics are useful, but leadership needs to understand the decisions behind them.
For sales, reporting may support decisions about customer follow-up, account growth, pricing, product demand, territory planning, or channel strategy.
Customer service reporting may help decide where to improve communication, which recurring issues need operational review, what customer segments need attention, or which products are creating support pressure.
When systems are disconnected, sales and service teams may work with incomplete information.
A representative may not see order status, payment history, fulfillment updates, inventory availability, or recent customer issues. Dashboards may show activity, but not the full relationship.
Decision-based reporting helps connect customer-facing data to business action.
It can show which accounts need attention, which issues are recurring, where service delays affect retention, and how customer experience connects with operations.
How System Integrations Make Reporting More Useful
Decision-based reporting often depends on connected systems.
If data lives across disconnected tools, reports may be delayed, incomplete, or difficult to trust.
A leadership team may need one view that includes sales, finance, inventory, customer service, fulfillment, and operations. If each area sits in a separate system, someone may need to export data, clean spreadsheets, reconcile numbers, and explain differences before decisions can be made.
Integrations reduce that friction.
They help data move between platforms automatically so reports can be built on more current and consistent information.
Common integration opportunities include:
- CRM and accounting software
- e-commerce and ERP
- inventory and warehouse systems
- fulfillment and customer service tools
- payment processors and finance workflows
- project management and billing systems
- NetSuite and reporting dashboards
- purchasing and inventory planning
The purpose of integration is not only technical.
The business purpose is better decision-making.
When systems connect around the decisions leadership needs to make, reporting becomes faster, clearer, and more useful.
How Automation Improves Reporting Cadence
Automation helps reporting arrive at the right time.
Many reporting delays come from repeated manual steps. Someone exports data, updates a spreadsheet, sends a report, flags an exception, or reminds a manager to review an issue.
Automation can reduce that manual burden.
It can support recurring reports, dashboard updates, exception alerts, low-stock notifications, overdue order flags, customer service summaries, finance reminders, and approval workflows.
For leadership, automation creates timelier visibility.
The team does not need to wait for every report to be manually prepared. Important signals can appear when action is still possible.
Automation should be designed carefully.
A company should first define the decision, the trigger, the owner, and the expected response. Otherwise, automated reports can become noise.
Good automation makes decision-based reporting easier because it delivers the right information to the right person at the right time.
Where NetSuite Fits Into Decision-Based Reporting
NetSuite can support decision-based reporting when it is configured around the way the business operates.
Many companies use NetSuite dashboards, saved searches, reports, workbooks, KPIs, and connected workflows to improve visibility across finance, inventory, purchasing, orders, customers, fulfillment, and operations.
The value depends on design.
A saved search should not exist only because the data is available. A dashboard should not be built only because someone requested a chart. A workbook should not be created without knowing who will use it and what decision it supports.
NetSuite reporting becomes more useful when each reporting artifact has a purpose.
Which team uses it? What question does it answer? Which decision does it support? How often should it be reviewed? What action should happen when the number changes?
For North Carolina companies already using NetSuite, reporting improvement may begin with a reporting inventory. That means reviewing existing saved searches, reports, dashboards, workbooks, spreadsheets, duplicate outputs, owners, and manual workarounds.
For companies considering NetSuite, decision-based reporting should be part of implementation planning from the beginning.
How to Build Decision-Based Reporting
A decision-based reporting process can start with a simple framework.
First, list the decisions leadership needs to make regularly.
These might include purchasing decisions, staffing decisions, pricing decisions, customer follow-up decisions, inventory decisions, cash flow decisions, fulfillment decisions, or growth investment decisions.
Next, identify the reports currently used for each decision.
Some decisions may have several reports. Others may have none. A few reports may exist but not be trusted.
After that, review the data sources.
Where does the information come from? Which systems are involved? Are there manual exports? Do definitions match? Who owns the metric?
Then clarify cadence.
How often does the decision happen? Daily, weekly, monthly, seasonally, or only when a threshold is reached?
Finally, define the action.
What should happen when the report shows a change? Who reviews it? Who owns the response? What threshold requires escalation?
This process helps the company build reports that support action instead of simply displaying information.
What to Review Before Building Another Dashboard
Before building another dashboard, leadership teams should review the current reporting environment.
Useful questions include:
- Which decisions are we trying to support?
- Which reports already exist?
- Who owns each report?
- Which reports are duplicated?
- Which dashboards are trusted?
- Where do numbers conflict?
- Which reports require manual spreadsheet work?
- Which systems provide the data?
- Are definitions consistent across teams?
- What action should each dashboard support?
- Does the dashboard arrive at the right cadence?
- What information is missing?
These questions help avoid building another reporting layer on top of unresolved issues.
In many cases, the business may not need a new dashboard first.
It may need reporting cleanup, system integration, metric definitions, automation, ownership, or ERP improvement.
Decision-based reporting North Carolina leadership teams can trust usually begins by understanding the reports they already have.
Composite Example: A Charlotte Product-Based Business
Consider a growing product-based business in Charlotte.
The company has dashboards for sales, inventory, customer service, and finance. Each dashboard provides useful information, but leadership still struggles to make fast decisions during busy periods.
Sales shows strong order growth. Inventory reports show stock on hand. Finance reports revenue. Customer service tracks open issues. Fulfillment reports delayed orders.
Individually, each dashboard works.
Together, they do not answer the most important questions.
Which products are driving profitable growth? What inventory is truly available? Which delayed orders affect key customers? Are fulfillment costs reducing margin? Should purchasing reorder now or wait? Which customer issues require operational change?
The company reviews reporting around decisions instead of dashboards.
It connects sales, inventory, fulfillment, finance, and customer service data more clearly. Reports are redesigned around actions: reorder, follow up, adjust staffing, review margin, resolve delays, or escalate customer issues.
The dashboards remain useful.
Now they support decisions instead of only displaying activity.
Composite Example: A Raleigh Service Company
A service company near Raleigh has several tools for CRM, scheduling, billing, project management, and reporting.
Leadership can access dashboards in each system, but meetings still involve manual explanation. Managers bring updates from different platforms. Finance has billing data. Operations has scheduling details. Customer service has customer issues. Project teams have status notes.
The information exists.
The decision view is missing.
Leadership wants to know which work is at risk, which customers need follow-up, where capacity is tight, which projects may affect cash flow, and which services are most profitable.
The company starts by listing recurring decisions.
Then it maps reports to those decisions. Some dashboards are kept. Others are consolidated. A few manual spreadsheets are replaced by connected reporting. Automated alerts are created for exceptions that need timely review.
The result is not more reporting.
It is better reporting.
How Good People Technologies Helps With Decision-Based Reporting
Good People Technologies helps growing businesses improve reporting visibility through system integrations, workflow automation, NetSuite consulting, ERP planning, reporting cleanup, and practical technology strategy.
For leadership teams moving toward decision-based reporting, this can include:
- reviewing current dashboards and reports
- building a reporting inventory
- mapping reports to business decisions
- identifying duplicate or conflicting reports
- reducing manual spreadsheet reporting
- improving NetSuite dashboards and saved searches
- connecting systems for better data flow
- automating recurring reports and alerts
- clarifying reporting ownership
- building phased reporting roadmaps
The work starts with the decisions that matter most.
Some companies need cleaner dashboards. Others need better integrations, automation, ERP improvements, or NetSuite reporting cleanup. A few need to define metrics and ownership before changing technology.
If your leadership team has dashboards but still waits for answers, Good People Technologies can help identify where reporting should be redesigned around decisions.
Final Thoughts
North Carolina leadership teams do not need dashboards just to have dashboards.
They need reporting that helps them decide what to do next.
A dashboard can show revenue, inventory, orders, customer issues, cash flow, or project status. That information is useful, but it becomes more powerful when it is tied to a decision, owner, cadence, threshold, and action.
Decision-based reporting North Carolina companies can rely on helps leadership move from reviewing numbers to managing the business with more confidence.
It clarifies which reports matter, which metrics need context, which systems should connect, which dashboards are trusted, and which decisions still lack visibility.
The goal is not more reporting.
The goal is better decisions.
When reporting starts with the decisions the business needs to make, dashboards become more useful, meetings become more focused, and teams can respond faster to growth, risk, and opportunity.
Frequently Asked Questions
What is decision-based reporting?
Decision-based reporting is a reporting approach that starts with the business decision a report should support, then designs the data, format, cadence, and ownership around that decision.
Why are dashboards not always enough?
Dashboards are not always enough because they may show data without explaining what action should be taken, who owns the response, or what decision the information supports.
How is decision-based reporting different from traditional reporting?
Traditional reporting often starts with available data. Decision-based reporting starts with the decision the business needs to make and then identifies the data needed to support it.
Why do North Carolina leadership teams need decision-based reporting?
North Carolina leadership teams need decision-based reporting because growing companies often have more systems, more data, more dashboards, and more complexity, but still need clearer decisions.
Can NetSuite support decision-based reporting?
Yes. NetSuite can support decision-based reporting through dashboards, saved searches, workbooks, KPIs, reports, and connected ERP data when configured around business decisions.
What should be reviewed before building a new dashboard?
Leadership teams should review existing reports, data sources, metric definitions, report ownership, manual spreadsheets, duplicate reports, and the decisions the dashboard should support.
How do integrations improve reporting?
Integrations improve reporting by helping data move automatically between systems, reducing manual exports, inconsistent numbers, delayed updates, and spreadsheet dependency.
How does automation help decision-based reporting?
Automation helps by delivering recurring reports, alerts, updates, and exception notifications at the right time so teams can act sooner.
What is a reporting inventory?
A reporting inventory is a structured list of dashboards, reports, saved searches, workbooks, spreadsheets, and manual reporting processes, including ownership and decision support.
How can Good People Technologies help?
Good People Technologies helps businesses review dashboards, map reports to decisions, improve NetSuite reporting, connect systems, automate reporting workflows, and build practical reporting roadmaps.

Roman is a B2B marketing specialist focused on technology, ERP systems, business automation, and digital growth strategies. At Good People Technologies, he helps translate complex technology solutions—such as ERP integrations, system integrations, and business process automation—into clear insights for founders, operators, and growing companies.
His work focuses on content strategy, SEO, and thought leadership that helps businesses understand how the right technology infrastructure can support scalable operations and sustainable growth.
At Good People Technologies, Roman contributes to content that explores ERP implementation, automation strategies, and system integration best practices for companies navigating rapid growth and operational complexity.